
In the context of mapping tools, sectorization is an operation which makes it possible to group points by geographical areas. There are different possibilities to group the points according to the desired criteria: by country, region, postal code, city, etc. Here we use the GPS coordinates to delimit rectangular areas.
This article is intended for regular users of the Open Street service, who are familiar with all the possibilities of the service, and wish to go further. The perfect mastery of Excel spreadsheet (or equivalent) is required.
Sommaire
Introduction
Sectorizing points, an operation that can be useful in many cases of figures related to the optimization of road itineraries. Imagine the following: you have a list of 30 addresses for physical appointments, but you know fully well that a single itinerant person will not be able to make more than 10 appointments a day, taking into account their duration.
Two possibilities often appear in the head of our users :
- Conduct the theoretical (fictional) tour with the 30 points, knowing that it will be concretely realized in several pieces.
- Sectorize the address file, i.e group the addresses intelligently by zones.
We advise against the first possibility because it consists in calculating an optimization which will not be representative of the path actually carried out. The difference between computation and real life can then be more or less important, generally it is penalizing. To give an idea, the extra cost of this method in distance traveled can easily reach or exceed the entire diagonal of the area covered by the points.
The danger of neglecting sectorisation
To understand why it is advised not to carry out an optimization involving all your points while knowing that it can not be traveled in this way, here is a file of addresses distributed on the French territory.
|
1 2 3 4 5 6 7 8 9 10 11 12 13 14 15 16 17 18 19 20 21 22 23 24 25 26 27 28 29 30 |
Préfecture de Ain, Bourg-en-Bresse, France Préfecture de Aisne, Laon, France Préfecture de Allier, Moulins, France Préfecture de Alpes-de-Haute-Provence, Digne-les-Bains, France Préfecture de Hautes-Alpes, Gap, France Préfecture de Alpes-Maritimes, Nice, France Préfecture de Ardèche, Privas, France Préfecture de Ardennes, Charleville-Mézières, France Préfecture de Ariège, Foix, France Préfecture de Aube, Troyes, France Préfecture de Aude, Carcassonne, France Préfecture de Aveyron, Rodez, France Préfecture de Bouches-du-Rhône, Marseille, France Préfecture de Calvados, Caen, France Préfecture de Cantal, Aurillac, France Préfecture de Charente, Angoulême, France Préfecture de Charente-Maritime, La Rochelle, France Préfecture de Cher, Bourges, France Préfecture de Corrèze, Tulle, France Préfecture de Côte-d’Or, Dijon, France Préfecture de Côtes-d’Armor, Saint-Brieuc, France Préfecture de Creuse, Guéret, France Préfecture de Dordogne, Périgueux, France Préfecture de Doubs, Besançon, France Préfecture de Drôme, Valence, France Préfecture de Eure, Évreux, France Préfecture de Eure-et-Loir, Chartres, France Préfecture de Finistère, Quimper, France Préfecture de Gard, 10 Avenue Feuchères, Nîmes, France Préfecture de Haute-Garonne, Toulouse, France |
This list of addresses will be imported into the service using an Excel import, or an import of text file. So we have the next map. A right click on each blue marker will give you access to its GPS coordinate, which is also a table in the calculation report.
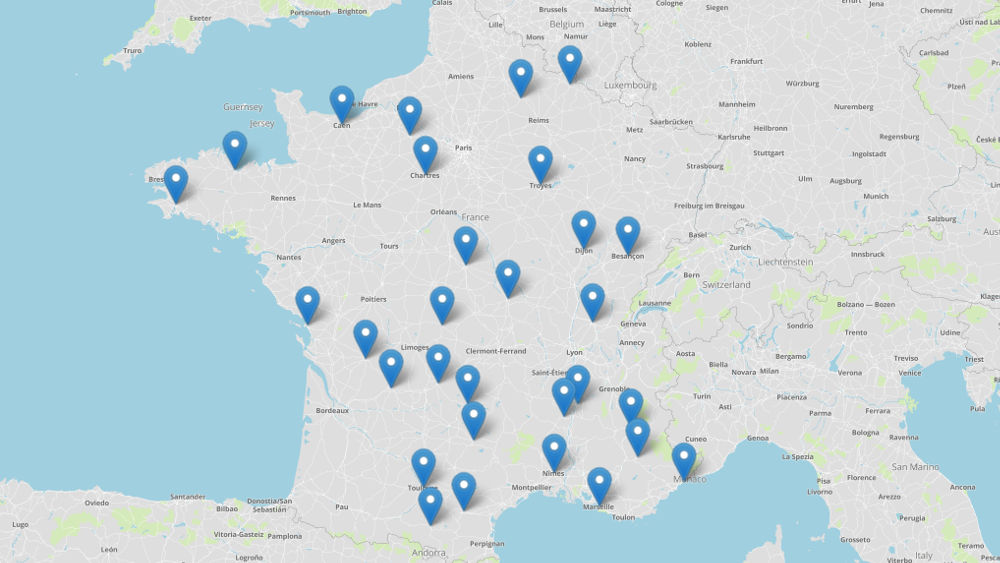
The 30 points are displayed on the map (blue markers)
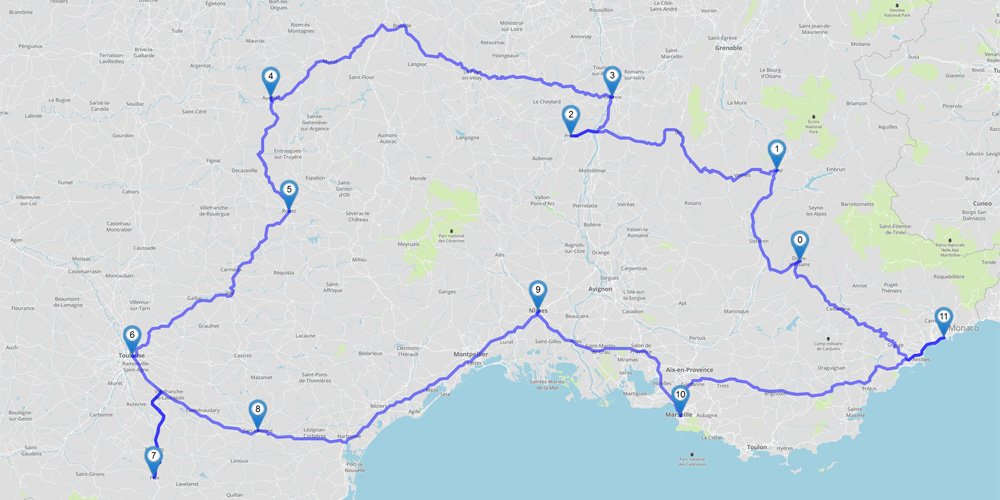
If we neglect the sectorization, we can try to optimize the itinerary as it is. Here we have calculated a loop route. The points have been positioned on France that we all know, in the case of this study we will assume that 10 points can be rallied by day regardless of the mileage. If this hypothesis is questionable on a territorial scale, it will make sense on more local optimizations at the level of a city or a region.
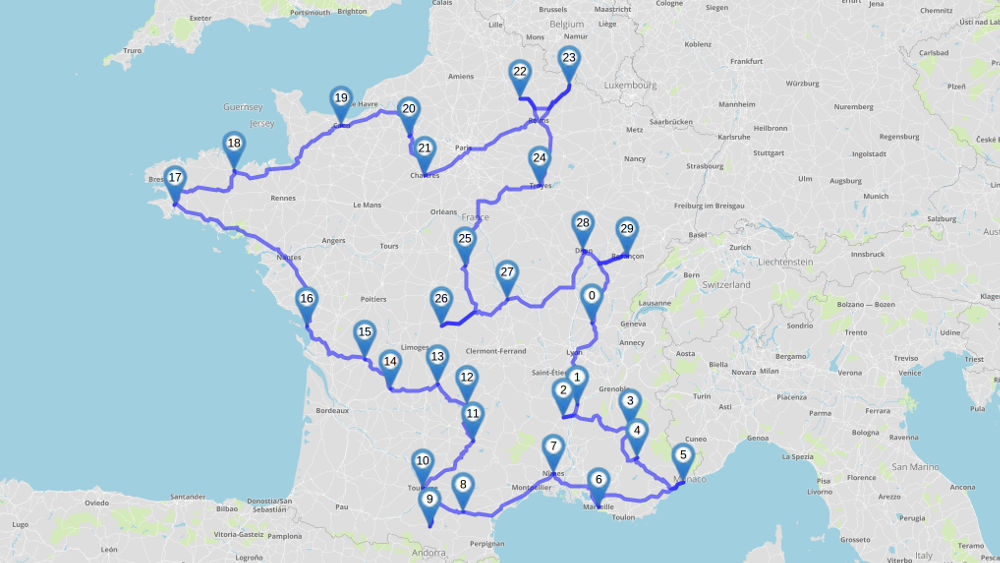
Optimised route between 30 points
What if we were to follow this itinerary from point n°0 to point n°29, knowing that only 10 points can be rallied per day?
- First journey: from the north of Lyon to the south of Toulouse
- Second journey: from the south of Toulouse to Caen
- Third way: from Caen to Besançon
The problem here is clear: the second journey and the third route make us leave our zone, so we cross the whole country diagonally instead of being confined to a zone and then another zone. Route optimization is able to trace routes that circle the area, a spiral, or any predictable or incongruous shape to minimize travel time and distance traveled. Most often, route optimization takes the highways.
Determining the zones
The method of segmentation dealt with in this article uses the GPS coordinates. We use here the simplest geographical contour to exploit: the rectangle defined by its four corners. We need to know the GPS coordinates of the four points (latitude, longitude). For this we have here sought a city at the corner location ideal for our rectangle, and Open Street gave us the GPS coordinates of this city. It would have been possible to obtain coordinates (latitude, longitude) from a GPS or any other geographic data source.
The latitude can be represented by the axis of the height and the longitude by the axis of the width of our rectangle.
Here is the proposal of the zones that is made in this example.
- Zone n°1, the north of France bounded by:
- Top right: Namur in Belgium with the coordinates 50.4673,4.8719
- Bottom left: Kerbabic in Bretagne with coordinates 47.9792,-4.1071
- At the top left you can extrapolate the coordinate 50.4673,-4.1071 (Not useful here)
- Bottom right you can extrapolate the coordinate 47.9792,4.8719 (Not useful here)
- Zone n°2, the center of France delimited by:
- Top right: Lure in France with coordinates 47.6864,6.4942
- Bottom left: Montpon-Ménéstérol in France with the coordinates 45.0092,0.1620
- Zone n°3, the south of France delimited by:
- Top right: Turin in Italy with coordinates 45.0703,7.6868
- Bottom left: Lannemezan in France with the coordinates 43.1255,0.3839
In anticipation of our Excel formula, we know that if the latitude of an arbitrary point is included in the interval [47.9792,50.4673] and its longitude is within the range [-4.1071,4.8719], Then the point belongs to our Zone n°1.
Another more mathematical formulation is:
- IF latitude > 47.9792 AND latitude < 50.4673 AND longitude > -4.1071 AND longitude < 4.8719 THEN then the point belongs to Zone n°1.
- IF latitude > 45.0092 AND latitude < 47.6864 AND longitude > 0.1620 AND longitude < 6.4942 THEN the point belongs to Zone n°2.
- IF latitude > 43.1255 AND latitude < 45.0703 AND longitude > -0.3839 AND longitude < 7.6868 THEN the point belongs to Zone n°3.
If we were to graphically represent our three zones, this is what we would get. An image manipulation software was used here.
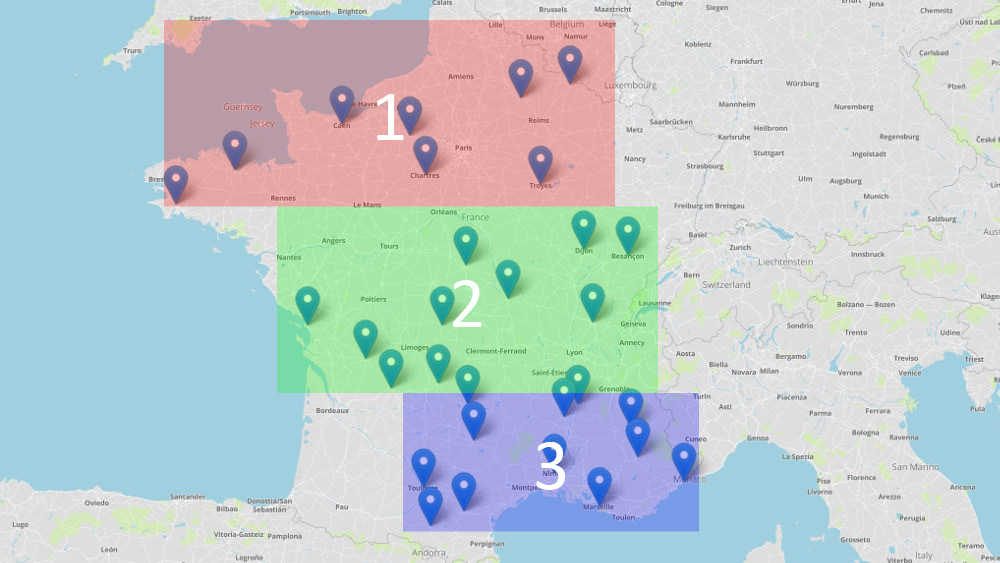
Map of France divided into 3 zones
Import GPS coordinates into Excel
Whatever address input method is used, you can export the GPS coordinates in batch using the report, once the points have been positioned on the map. To do this, look for the «Table of geographic data» and the link «CSV» to download an Excel compatible file. You can read our article about geocoding and GPS coordinates.
As often with Excel to open a CSV file you will need to use the wizard to import text data by choosing an encoding (Unicode UTF-8) and a field separator (comma). The list of addresses with coordinates is thus obtained.
The CSV file created by Open Street contains the following fields: identifier (id), address understood by the service and address_formatted, address_typed, latitude (lat), longitude (lng)…
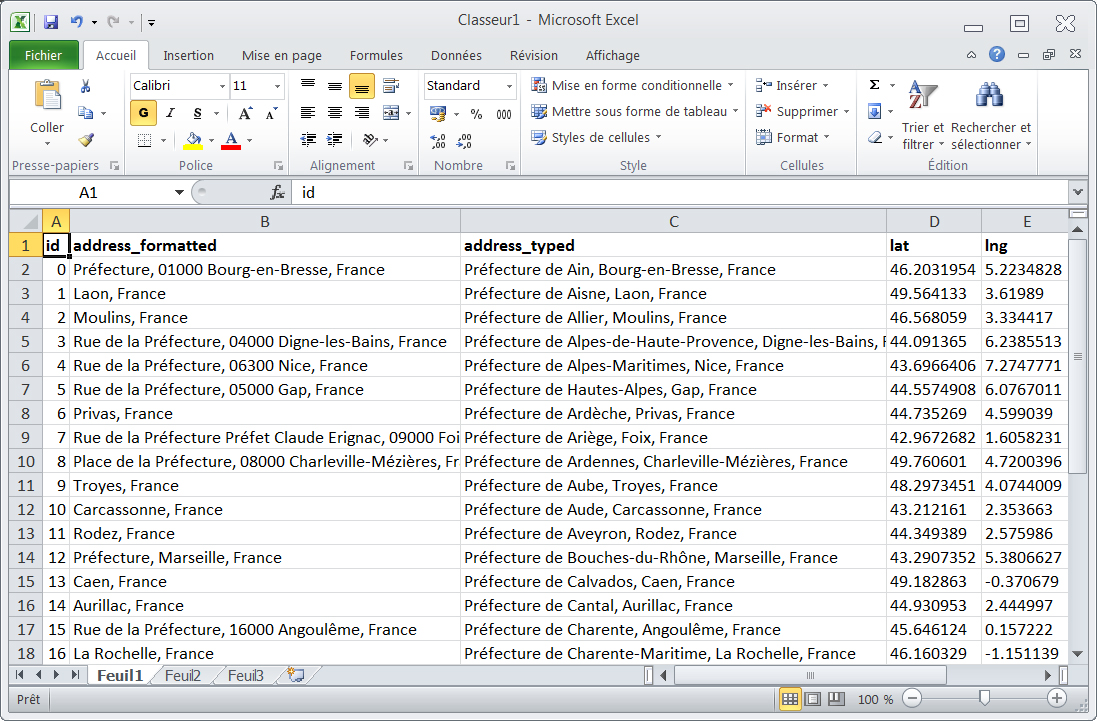
GPS coordinates in Excel
On European version of Excel, it is not always able to understand that the point is a decimal separator so it may be necessary to replace the points with commas with the function «search and replace».
The formulas used in columns F, G and H are respectively:
- =IF(AND(D2>47,9792;D2<50,4673;E2>-4,1071;E2<4,8719);1;0)
- =IF(AND(D2>45,0092;D2<47,6864;E2>0,1620;E2<6,4942);1;0)
- =IF(AND(D2>43,1255;D2<45,0703;E2>-0,3839;E2<7,6868);1;0)
For this article we use a conditional formatting that respects the red color for Zone 1, Green for Zone 2 and Blue for Zone 3. Then the table is sorted according to columns F, G and H.
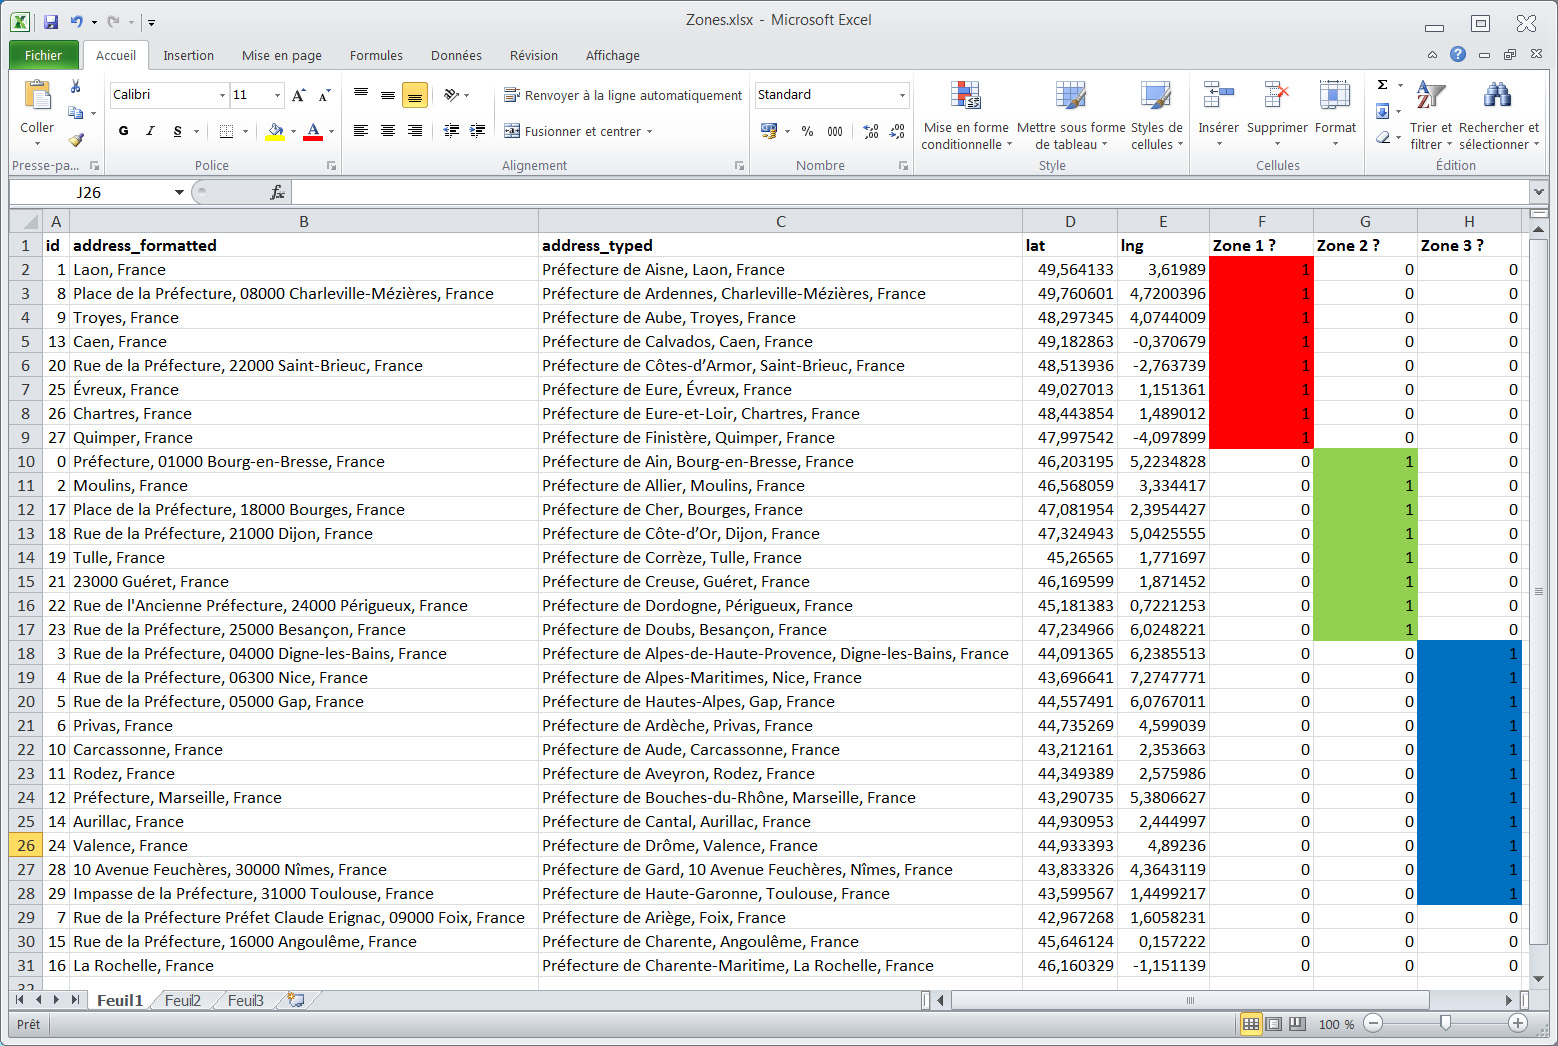
Sorting geographical points according to their GPS coordinates with Excel
The last three points do not belong to any zone, it means that they should be adjacent to the areas we have previously defined roughly. To correct this we could modify our zones or manually reintegrate them into one of our three zones. It is this second choice of facility that we will retain: Foix is in zone 3, Angoulême and La Rochelle are in zone 2.
Our three zones can thus give rise to three imports of points, and three different optimizations.
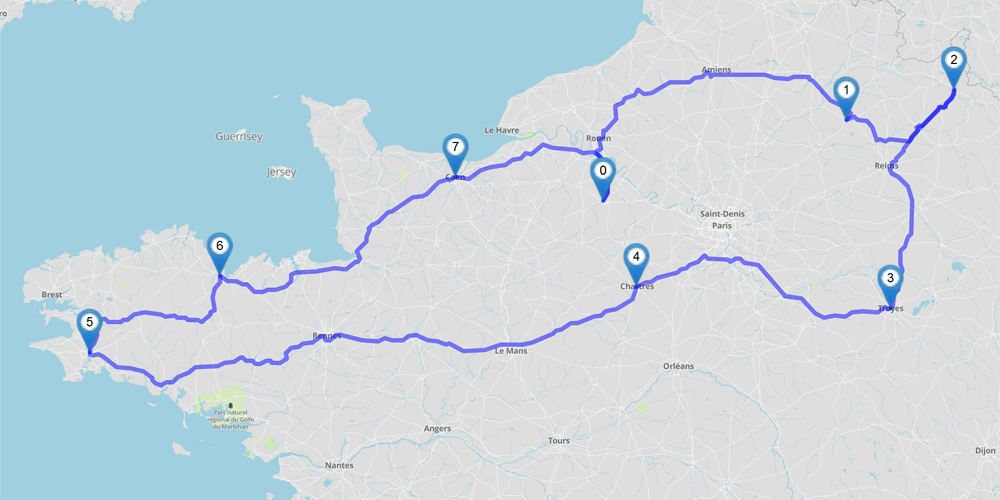
Optimisation of the zone n°1
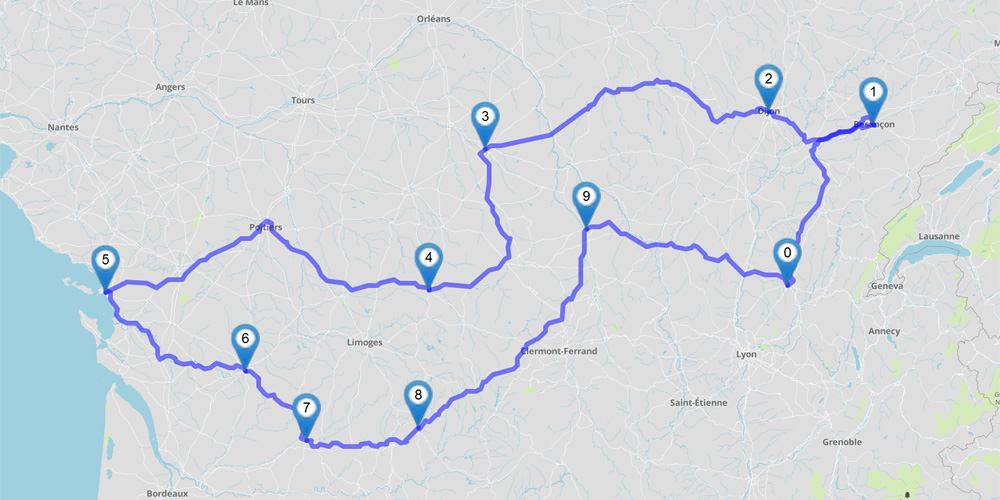
Optimisation of the zone n°2
Optimisation of the zone n°3
Conclusion
An obvious criticism of the example we have chosen in this example is the excessive distance that each zone represents. Moreover, in specific cases there would probably be a point to be integrated in each of the zones: the driver’s domicile or the place where goods were stored.
We have therefore segmented points for their belonging to an area with a rectangular outline using the Open Street service and common office tools. The search for corners that delimit this area remains a tedious operation because it requires to find an approaching address and to extract the coordinates thanks to the application on line or any other equivalent service.
Point segmentation by GPS coordinates is not the only existing method, far from it. Simpler, you can group points by postal code for example. More sophisticated, we could delineate complex zones with a non-rectangular contour, taking into account the density of points per unit area. There are high-performance software to carry out such operations, called (GIS) and some of them are rather expensive.
Nevertheless, this logical and powerful method can be useful in concrete cases.