This page explains how the Open Street service uses mathematical tools, such as graph theories, to describe the problems of the commercial traveler hidden behind each optimization calculation.
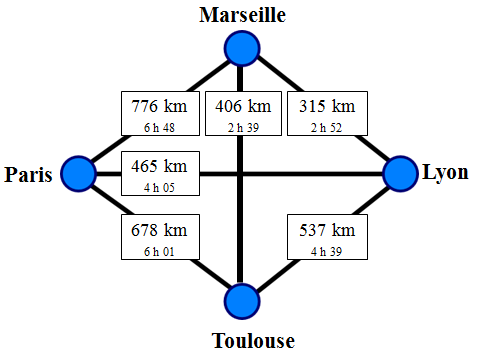
It allows you to model and then solve problems as you enter them into our service or our APIs. Let us take the example of a journey to pass through Paris, Marseille, Lyon and Toulouse.
This four-city route is the simplest example possible, which can be described by a graph composed of nodes and links. Here the nodes are represented in blue disks and the links in black lines.

Unoriented graph with four points
The graph above is very simplified because in practice, all the links are double. Indeed, the distance between Paris and Toulouse is not exactly the same as that between Toulouse and Paris, mainly because of the forbidden directions and asymmetric motorway junctions. We say in this case that the graph is «oriented ».
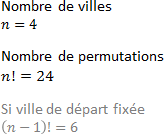
Thus, the combinatorics indicate that there are 24 different path possibilities. By fixing a city as a starting point, this figure drops to 6.

Possible combinations for the traveler salesman problem
For such a small number of cities, one can easily visualize these 6 possibilities. It’s a 6 by 4 chart.

Table of possibilities illustrating the commercial traveler’s problem.
Now we have 40 cities to visit. The corresponding graph would contain 40 nodes connected to each other by two-way links. The combinatorics indicate that the number of different possibilities to make this route is astronomical. There are, in fact, 203 978 820 811 97 443 358 640 281 739 902 897 356 800 000 000.

The factorial makes it possible to calculate the number of possible routes for an optimization (here of 40 points)
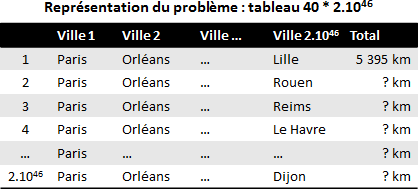
The table representation would have 40 columns and 2 1046 lines. Comparing all these possibilities with the world’s most powerful computer would take centuries. In practice, it is impossible from only a few tens of cities.

Table of possibilities for an optimization of 40 points
However, the Open Street service can optimize routes to several thousand cities. You will know, we do not try to compare all the possible routes, but we use much more elaborate algorithms which benefits you.
